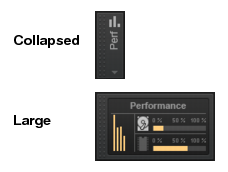
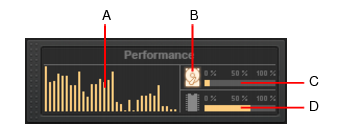
Cakewalk // Documentation // Cakewalk // Performance module
Table of Contents Previous Next Index

Control Bar overview ► Performance module

A. CPU meters (one per core) B. Disk Activity indicator C. Disk Space meter D. Memory Usage meter
*
CPU meters. The CPU meters let you monitor your computer’s CPU activity. Right-click the CPU meters to specify the global CPU meter mode:
*
Audio Processing. Measures Cakewalk’s audio processing load, which is the time it takes to process a buffer full of audio data as a percentage of the maximum time available to process that data and maintain uninterrupted playback. There is one CPU meter for each core in your computer, up to 32 cores. There is some tolerance built into the meter, so it is possible that it will exceed 100% at times (more so during recording than playback).
*
System Performance. Displays the global system-wide load across all cores, as reported by the operating system rather than by measuring Cakewalk’s audio processing load.
*
Overall App Performance. Displays a single CPU meter for the entire Cakewalk process CPU utilization across all cores.
*
Disk Activity indicator . Measures how much of the available time Cakewalk is using to perform input/output functions on your hard disk. The size of your setup’s I/O buffer size (listed under File System in Edit > Preferences > Audio - Sync and Caching) determines how much time is allowed to perform disk operations and maintain uninterrupted playback. When Cakewalk performs disk operations, the Disk Activity indicator changes color from yellow to red to indicate the time Cakewalk is taking to complete each cycle of disk input/output. A red icon indicates very high data activity.
*
Disk Space meter. Shows the amount of available space on the drive where your wave data directory is located. The tooltip shows the actual remaining disk space on your audio disk.
*
Memory Usage (RAM) meter. Shows the total memory (RAM) usage by your computer, not just by Cakewalk.
Diagnosing glitches in audio playback is easy with the Engine Load and Late Buffers metrics in the Performance module tooltip. To view these new metrics, hover the mouse over the Performance module. Note: you must have Show Tooltips enabled in Preferences > Customization - Display to see this.
The Engine Load value is a percentage of the total time the engine took to process an audio buffer. If it takes 100% or more of the allotted time, the buffer is processed too late and it will result in audio glitches/distortion. The value in parenthesis represents the max engine load since the time the engine started.
The Late Buffers count indicates the total number of buffers that took too long to process since the time the engine started. Too many late buffers will result in audible glitches or distortion in playback due to the audio device not receiving buffers in time.
Copyright © 2024 Cakewalk, Inc. All rights reserved
Sitemap | Privacy Policy | Legal